Cost overview totals
The cost model was run for each case with the input cost elements set to their base (most probable) values, according to the case. The corresponding costs have been termed the "Medium" scenarioA plausible description of the future based on an internally consistent set of assumptions about key relationships and driving forces; note that scenarios are neither predictions nor forecasts. Subsequently the model was run to determine the three main uncorrelated drivers that had the largest impact on cost: field capacity, wellManmade hole drilled into the earth to produce liquids or gases, or to allow the injection of fluids capacity (injectivityA measure of the rate at which a quantity of fluid can be injected into a well times the life of the wellManmade hole drilled into the earth to produce liquids or gases, or to allow the injection of fluids) and liability. Other cost items associated to wellManmade hole drilled into the earth to produce liquids or gases, or to allow the injection of fluids capacity sometimes have a large impact on cost (e.g. wellManmade hole drilled into the earth to produce liquids or gases, or to allow the injection of fluids completion(well) Refers to the cementing and perforating of casing and stimulation to connect a well bore to reservoir cost), but these are related to the wellManmade hole drilled into the earth to produce liquids or gases, or to allow the injection of fluids capacity driver. Liability, though, is entirely decoupled from other items and has a great impact on Low cost scenarios (IEAGHG, 2012).
Low and High cost scenarios were then attained as follows: for each case, the model was run with these three chief drivers set to their minimum values for the Low cost scenarios and maximum values for the High cost scenarios, while taking care of their combined effects. Such a procedure has the advantage over mathematically more rigorous techniques (e.g. Monte CarloA modelling technique in which the statistical properties of outcomes are tested by random inputs techniques) that the Low and High scenarios correspond to a transparent set of input cost elements, while still representing realistic (reasonably probable) Low and High scenarios.
The total storage(CO2) A process for retaining captured CO2, so that it does not reach the atmosphere COsts estimated by the ZEPEuropean Technology Platform for Zero Emission Fossil Fuel Power Plants study are presented in Fig. 7-1 with the CAPEX/OPEX per case presented in Tab. 7-4, 7-5, 7-6, 7-7, 7-8 and 7-9.
| 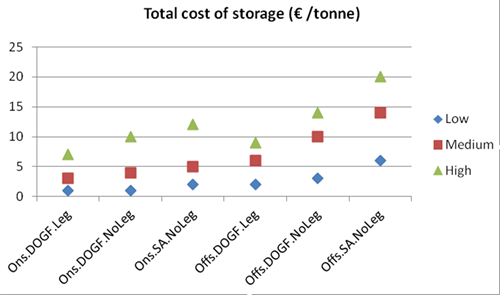
Fig. 7-1: Total cost of storage(CO2Carbon dioxide) A process for retaining captured CO2Carbon dioxide, so that it does not reach the atmosphereThe layer of gases surrounding the earth; the gases are mainly nitrogen (78%) and oxygen (around 21%) (€/tonne). After IEAGHG (2012). |
| Tab. 7-4: Ons.DOGF.Leg cost summary - annualised CAPEX takes the WACC into account, after IEAGHG, 2012. | | Ons.DOGF.Leg | | | Low | Medium | High | | CO2Carbon dioxide stored (MtMillion tonnes) | 200 | 66 | 40 | | Lifetime (yr) | 40 | 40 | 40 | | CO2Carbon dioxide rate (MtMillion tonnes p a) | 5 | 2 | 1 | | CAPEX (M€) | 27 | 27 | 29 | | Annualised CAPEX (M€ p a) | 2 | 2 | 2 | | OPEX (M€ p a) | 2 | 3 | 4 | | CAPEX (€ per tonne) | 0 | 0 | 1 | | Annualised CAPEX (€ per tonne) | 0 | 1 | 2 | | OPEX (€ per tonne) | 0 | 2 | 4 | | Cost of storage(CO2Carbon dioxide) A process for retaining captured CO2Carbon dioxide, so that it does not reach the atmosphereThe layer of gases surrounding the earth; the gases are mainly nitrogen (78%) and oxygen (around 21%) (€ per tonne) | 1 | 3 | 7 | |
| Tab. 7-5: Ons.DOGF.NoLeg cost summary - annualised CAPEX takes the WACC into account. After IEAGHG (2012). | | Ons.DOGF.NoLeg | | | Low | Medium | High | | CO2Carbon dioxide stored (MtMillion tonnes) | 200 | 66 | 40 | | Lifetime (yr) | 40 | 40 | 40 | | CO2Carbon dioxide rate (MtMillion tonnes p a) | 5 | 2 | 1 | | CAPEX (M€) | 48 | 48 | 68 | | Annualised CAPEX (M€ p a) | 4 | 4 | 6 | | OPEX (M€ p a) | 2 | 3 | 4 | | CAPEX (€ per tonne) | 0 | 1 | 2 | | Annualised CAPEX (€ per tonne) | 1 | 2 | 6 | | OPEX (€ per tonne) | 0 | 2 | 4 | | Cost of storage(CO2Carbon dioxide) A process for retaining captured CO2Carbon dioxide, so that it does not reach the atmosphereThe layer of gases surrounding the earth; the gases are mainly nitrogen (78%) and oxygen (around 21%) (€ per tonne) | 1 | 4 | 10 | |
| Tab. 7-6: Ons.SA.NoLeg cost summary - annualised CAPEX takes the WACC into account. After IEAGHG (2012). | | Ons.SA.NoLeg | | | Low | Medium | High | | CO2Carbon dioxide stored (MtMillion tonnes) | 200 | 66 | 40 | | Lifetime (yr) | 40 | 40 | 40 | | CO2Carbon dioxide rate (MtMillion tonnes p a) | 5 | 2 | 1 | | CAPEX (M€) | 70 | 70 | 89 | | Annualised CAPEX (M€ p a) | 6 | 6 | 7 | | OPEX (M€ p a) | 2 | 3 | 4 | | CAPEX (€ per tonne) | 0 | 1 | 2 | | Annualised CAPEX (€ per tonne) | 1 | 4 | 7 | | OPEX (€ per tonne) | 0 | 2 | 4 | | Cost of storage(CO2Carbon dioxide) A process for retaining captured CO2Carbon dioxide, so that it does not reach the atmosphereThe layer of gases surrounding the earth; the gases are mainly nitrogen (78%) and oxygen (around 21%) (€ per tonne) | 2 | 5 | 12 | |
| Tab. 7-7: Offs.DOGF.Leg cost summary - annualised CAPEX takes the WACC into account. After IEAGHG (2012). | | Offs.DOGF.Leg | | | Low | Medium | High | | CO2Carbon dioxide stored (MtMillion tonnes) | 200 | 66 | 40 | | Lifetime (yr) | 40 | 40 | 40 | | CO2Carbon dioxide rate (MtMillion tonnes p a) | 5 | 2 | 1 | | CAPEX (M€) | 56 | 48 | 44 | | Annualised CAPEX (M€ p a) | 5 | 4 | 4 | | OPEX (M€ p a) | 6 | 6 | 6 | | CAPEX (€ per tonne) | 0 | 1 | 1 | | Annualised CAPEX (€ per tonne) | 1 | 2 | 4 | | OPEX (€ per tonne) | 1 | 4 | 6 | | Cost of storage(CO2Carbon dioxide) A process for retaining captured CO2Carbon dioxide, so that it does not reach the atmosphereThe layer of gases surrounding the earth; the gases are mainly nitrogen (78%) and oxygen (around 21%) (€ per tonne) | 2 | 6 | 9 | |
| Tab. 7-8: Offs.DOGF.NoLeg cost summary - annualised CAPEX takes the WACC into account. After IEAGHG (2012). | | Offs.DOGF.NoLeg | | | Low | Medium | High | | CO2Carbon dioxide stored (MtMillion tonnes) | 200 | 66 | 40 | | Lifetime (yr) | 40 | 40 | 40 | | CO2Carbon dioxide rate (MtMillion tonnes p a) | 5 | 2 | 1 | | CAPEX (M€) | 127 | 120 | 96 | | Annualised CAPEX (M€ p a) | 11 | 10 | 8 | | OPEX (M€ p a) | 6 | 6 | 6 | | CAPEX (€ per tonne) | 1 | 2 | 2 | | Annualised CAPEX (€ per tonne) | 2 | 6 | 8 | | OPEX (€ per tonne) | 1 | 4 | 6 | | Cost of storage(CO2Carbon dioxide) A process for retaining captured CO2Carbon dioxide, so that it does not reach the atmosphereThe layer of gases surrounding the earth; the gases are mainly nitrogen (78%) and oxygen (around 21%) (€ per tonne) | 3 | 10 | 14 | |
| Tab. 7-9: Offs.SA.NoLeg cost summary - annualised CAPEX takes the WACC into account. After IEAGHG (2012). | | Offs.SA.NoLeg | | | Low | Medium | High | | CO2Carbon dioxide stored (MtMillion tonnes) | 200 | 66 | 40 | | Lifetime (yr) | 40 | 40 | 40 | | CO2Carbon dioxide rate (MtMillion tonnes p a) | 5 | 2 | 1 | | CAPEX (M€) | 238 | 199 | 169 | | Annualised CAPEX (M€ p a) | 20 | 17 | 14 | | OPEX (M€ p a) | 8 | 7 | 6 | | CAPEX (€ per tonne) | 1 | 3 | 4 | | Annualised CAPEX (€ per tonne) | 4 | 10 | 14 | | OPEX (€ per tonne) | 2 | 4 | 6 | | Cost of storage(CO2Carbon dioxide) A process for retaining captured CO2Carbon dioxide, so that it does not reach the atmosphereThe layer of gases surrounding the earth; the gases are mainly nitrogen (78%) and oxygen (around 21%) (€ per tonne) | 6 | 14 | 20 | |
Cost breakdown per project phase
Cost analysis per project phase provides insights regarding cost differentiators between cases and the succeeding project phases and associated cost components were consequently defined in the ZEPEuropean Technology Platform for Zero Emission Fossil Fuel Power Plants study (Tab. 7-10).
| Tab. 7-10: Project phases and associated cost elements. After IEAGHG (2012). | Phase | Description | Typical cost elements | | Pre-FID | Activities prior to decision whether to go ahead with injectionThe process of using pressure to force fluids down wells | Seismic survey, exploration wells, injectionThe process of using pressure to force fluids down wells testing, modelling, permitting | | Structure(geology) Geological feature produced by the deformation of the Earth’s crust, such as a fold or a fault(geology) A surface at which strata are no longer continuous, but are found displaced; a feature within a rock such as a fractureAny break in rock along which no significant movement has occurred; or, more generally, the spatial arrangement of rocks | Construction of supporting structure(geology) Geological feature produced by the deformation of the Earth’s crust, such as a fold or a fault(geology) A surface at which strata are no longer continuous, but are found displaced; a feature within a rock such as a fractureAny break in rock along which no significant movement has occurred; or, more generally, the spatial arrangement of rocks for injectionThe process of using pressure to force fluids down wells Wells (e.g. offshore platform) | New build or refurbishment (offshore) | | InjectionThe process of using pressure to force fluids down wells wells | Construction of injectors | Drilling of new wells, refurbishing of legacy wells | | Operating | CO2Carbon dioxide injectionThe process of using pressure to force fluids down wells phase (40 years) | Operations and maintenance OPEX | | MMV | MonitoringMeasurement and surveillance activities necessary for ensuring safe and reliable operation of a CGS project (storage integrity), and for estimating emission reductions activities (both during the injectionThe process of using pressure to force fluids down wells and the post-injectionThe process of using pressure to force fluids down wells phase) | Drilling of observation wells, monitoringMeasurement and surveillance activities necessary for ensuring safe and reliable operation of a CGS project (storage integrity), and for estimating emission reductions OPEX, final seismic survey | | Close down | Close down activities | Decommissioning, liability transfer | |
| 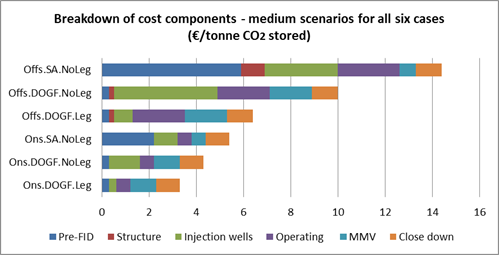
Fig. 7-2: Breakdown of cost components - medium scenarios for all six cases (€/tonne CO2Carbon dioxide stored), after IEAGHG, 2012. |
Variations and uncertainties
A broad sensitivity study was done in all the cases, not just for the three cost elements that were used to compute the ranges of cost - field capacity, wellManmade hole drilled into the earth to produce liquids or gases, or to allow the injection of fluids capacity and liability -, but also for the other top five cost elements that have a substantial effect on cost, i.e., wellManmade hole drilled into the earth to produce liquids or gases, or to allow the injection of fluids completion(well) Refers to the cementing and perforating of casing and stimulation to connect a well bore to reservoir, reservoirA subsurface body of rock with sufficient porosity and permeability to store and transmit fluids depth, WACC and the number of new observation and exploration wells. The cost impact of the other 18 cost elements was not found to be significant enough to be taken into account in the sensitivity study (IEAGHG, 2012).