In seismic measurements surface sources (e.g. dynamite, vibrating machines or air gun arrays for onshore and offshore use, respectively) are utilised to generate downward propagating elastic waves that are reflected from subsurface features and return to the surface where they are recorded by ground motion sensors (geophones), resulting in a three-dimensional view of the subsurface. In the case of a 3D survey, a regular 2D grid of surface sources and sensors is deployed. The recorded data are combined to produce a 3D image of the subsurface. The seismic survey provides an initial baseline that can be compared to changes in subsequent seismic surveys to create a time lapse image of CO2 plumeDispersing volume of CO2-rich phase contained in target formation migrationThe movement of fluids in reservoir rocks and to detect significant leakage(in CO2 storage) The escape of injected fluid from the storage formation to the atmosphere or water column or migrationThe movement of fluids in reservoir rocks of CO2Carbon dioxide from the storage(CO2) A process for retaining captured CO2, so that it does not reach the atmosphere site. Surface seismic techniques provide detailed spatial resolution of CO2Carbon dioxide distribution, but are less sensitive than wellManmade hole drilled into the earth to produce liquids or gases, or to allow the injection of fluids-based methods and, therefore, may require the presence of large volumes for detection of CO2Carbon dioxide (Monea et al., 20082008 - M. Monea, R. Knudsen, K. Worth, R. Chalaturnyk, D. White, M. Wilson, S. Plasynski, H. G. McIlvried, R. D. SrivastavaConsiderations for monitoring, mitigation, and verification for geologic storage of CO2see more).
Lumley (2010) describes various aspects of seismic monitoringMeasurement and surveillance activities necessary for ensuring safe and reliable operation of a CGS project (storage integrity), and for estimating emission reductions for CO2Carbon dioxide injectionThe process of using pressure to force fluids down wells: The effectiveness of the seismic monitoringMeasurement and surveillance activities necessary for ensuring safe and reliable operation of a CGS project (storage integrity), and for estimating emission reductions depends on the properties of the pore fluid (including the CO2Carbon dioxide) and the compressibility of the dry rock frame. If the dry-frame compressibility is low, i.e. the rock is stiff, the seismic measurements will not easily sense the properties of the pore fluid. When injecting into a depleted(hydrocarbon reservoir) one where production is significantly reduced hydrocarbon reservoirA subsurface body of rock with sufficient porosity and permeability to store and transmit fluids, depleted(hydrocarbon reservoir) one where production is significantly reduced oil with low solution gas-oil ratio (GOR) will give more favourable conditions for seismic monitoringMeasurement and surveillance activities necessary for ensuring safe and reliable operation of a CGS project (storage integrity), and for estimating emission reductions of CO2Carbon dioxide injectionThe process of using pressure to force fluids down wells than depleted(hydrocarbon reservoir) one where production is significantly reduced oil with high GOR. The presence of residual hydrocarbon gas in the pores will furthermore provide less favourable conditions for seismic monitoringMeasurement and surveillance activities necessary for ensuring safe and reliable operation of a CGS project (storage integrity), and for estimating emission reductions (cf. Picotti et al., 20122012 - Stefano Picotti, José M Carcione, Davide Gei, Giuliana Rossi, Juan E SantosSeismic modeling to monitor CO2 geological storage: The Atzbach‐Schwanenstadt gas fieldsee more).
In addition, the effectiveness of seismic monitoringMeasurement and surveillance activities necessary for ensuring safe and reliable operation of a CGS project (storage integrity), and for estimating emission reductions depends on the nature of the seismic acquisition set-up, in particular on the temporal frequency content of the data. This influences both subsurface resolution and the sensitivity for detection of gas or fluids. In order to achieve high resolution, it is necessary to record the high frequencies; however, high-frequency signals are also attenuated more quickly (which limits depth penetration) and more susceptible to effects of reverberation and scattering.
The injectionThe process of using pressure to force fluids down wells of CO2Carbon dioxide alters the compressibility and the density of the reservoirA subsurface body of rock with sufficient porosity and permeability to store and transmit fluids fluid, which has several effects on the seismic response. Firstly, the injectionThe process of using pressure to force fluids down wells changes the velocity of the seismic waves, which affects the time required for a seismic wave to pass through the reservoirA subsurface body of rock with sufficient porosity and permeability to store and transmit fluids. In seismograms, this can be observed, for example, as time shifts in waves reflected from layer boundaries below the reservoirA subsurface body of rock with sufficient porosity and permeability to store and transmit fluids, and this is a valuable tool for quantifying the amount of injected CO2Carbon dioxide (Fig. 2-2). In order to calculate the CO2Carbon dioxide layer thickness from the time shift, the velocity must be estimated, e.g. by using assumptions about porosityMeasure for the amount of pore space in a rock and CO2Carbon dioxide saturation (Chadwick et al., 20042004 - R. A. Chadwick, P. Zweigel, U. Gregersen, G. A. Kirby, S. Holloway and P. N. JohannessenGeological reservoir characterization of a CO2 storage site: The Utsira Sand, Sleipner, northern North Seasee more).
| 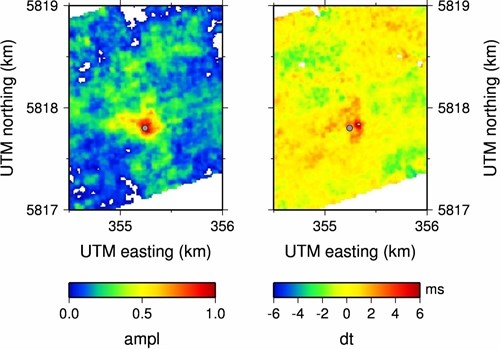
Fig. 2-2: Seismic attribute maps from time-lapse measurements during the project CO2SINK at Ketzin, Germany (Ivanova et al., 20122012 - Alexandra Ivanova, Artem Kashubin, Niklas Juhojuntti, Juliane Kummerow, Jan Henninges, Christopher Juhlin, Stefan Lüth, Monika IvandicMonitoring and volumetric estimation of injected CO2 using 4D seismic, petrophysical data, core measurements and well logging: a case study at Ketzin, Germanysee more). The grey symbol marks the injectionThe process of using pressure to force fluids down wells borehole. Left panel: Normalised time-lapse amplitude at the level of the reservoirA subsurface body of rock with sufficient porosityMeasure for the amount of pore spaceSpace between rock or sediment grains that can contain fluids in a rock and permeabilityAbility to flow or transmit fluids through a porous solid such as rock to store and transmit fluids, showing an amplitude anomaly due to the injected CO2Carbon dioxide. Right panel: Time shift of a reflection below the reservoirA subsurface body of rock with sufficient porosityMeasure for the amount of pore spaceSpace between rock or sediment grains that can contain fluids in a rock and permeabilityAbility to flow or transmit fluids through a porous solid such as rock to store and transmit fluids caused by a velocity pull-down effect due either to partial CO2Carbon dioxide saturation in the reservoirA subsurface body of rock with sufficient porosityMeasure for the amount of pore spaceSpace between rock or sediment grains that can contain fluids in a rock and permeabilityAbility to flow or transmit fluids through a porous solid such as rock to store and transmit fluids or to a pressure increase. |
Secondly, the injectionThe process of using pressure to force fluids down wells-induced changes in the reservoirA subsurface body of rock with sufficient porosity and permeability to store and transmit fluids have an effect on the amplitude and the frequency content of the reflected waves. By comparing seismic amplitude and frequency maps from measurements carried out before and after injectionThe process of using pressure to force fluids down wells, it is possible to track the CO2Carbon dioxide migrationThe movement of fluids in reservoir rocks with high lateral resolution (e.g. Chadwick et al., 20042004 - R. A. Chadwick, P. Zweigel, U. Gregersen, G. A. Kirby, S. Holloway and P. N. JohannessenGeological reservoir characterization of a CO2 storage site: The Utsira Sand, Sleipner, northern North Seasee more, Ivanova et al., 20122012 - Alexandra Ivanova, Artem Kashubin, Niklas Juhojuntti, Juliane Kummerow, Jan Henninges, Christopher Juhlin, Stefan Lüth, Monika IvandicMonitoring and volumetric estimation of injected CO2 using 4D seismic, petrophysical data, core measurements and well logging: a case study at Ketzin, Germanysee more). Volume estimates can also be derived by assuming relationships between reflection amplitude and CO2Carbon dioxide layer thickness, also requiring that additional assumptions are made about porosityMeasure for the amount of pore space in a rock and saturation (Chadwick et al., 20042004 - R. A. Chadwick, P. Zweigel, U. Gregersen, G. A. Kirby, S. Holloway and P. N. JohannessenGeological reservoir characterization of a CO2 storage site: The Utsira Sand, Sleipner, northern North Seasee more). It is also possible to combine the time shifts and the amplitudes to derive volume estimates, e.g. by using the time shift to estimate the thickness of the CO2Carbon dioxide layer and the amplitude to estimate saturation (Ivanova et al., 20122012 - Alexandra Ivanova, Artem Kashubin, Niklas Juhojuntti, Juliane Kummerow, Jan Henninges, Christopher Juhlin, Stefan Lüth, Monika IvandicMonitoring and volumetric estimation of injected CO2 using 4D seismic, petrophysical data, core measurements and well logging: a case study at Ketzin, Germanysee more).
Several recent studies on CO2Carbon dioxide storage(CO2Carbon dioxide) A process for retaining captured CO2Carbon dioxide, so that it does not reach the atmosphereThe layer of gases surrounding the earth; the gases are mainly nitrogen (78%) and oxygen (around 21%) reservoirs (Rabben and Ursin, 20112011 - Tor Erik Rabben, Bjørn UrsinAVA inversion of the top Utsira Sand reflection at the Sleipner fieldsee more; Rubino and Velis, 20112011 - J Germán Rubino, Danilo R VelisSeismic characterization of thin beds containing patchy carbon dioxide-brine distributions: A study based on numerical simulationssee more) utilise the amplitude variations of the reflected seismic wave as a function of incidence angle. This approach has been used for a long time in the hydrocarbon industry through amplitude versus offset (AVO) analysis, and there are different classes used to distinguish reservoirs based on the AVO characteristics. For a saline aquiferAn underground layer of fluid-bearing permeable rock or unconsolidated materials (gravel, sand, or silt) with significant permeability to allow flow environment, the injectionThe process of using pressure to force fluids down wells will cause a much smaller change in the S-wave velocity than in the P-wave velocity, and this has effects on the variation of reflection amplitude with incidence angle. Rabben and Ursin (2011) applied amplitude versus angle (AVA) analysis to seismic data from Sleipner to estimate seismic reflection coefficients, which ultimately can be used to calculate the mass of injected CO2Carbon dioxide. Numerical studies by Rubino and Velis (2011), again with focus on Sleipner (cf. Section 3.3.1), indicate that it may be possible to obtain reasonable thickness estimates for CO2Carbon dioxide-bearing layers having a thickness of only a few meters using AVA analysis.
The most established seismic method for detailed mapping of CO2Carbon dioxide migrationThe movement of fluids in reservoir rocks is 3D seismic reflection measurements, or rather 4D when carried out in time-lapse mode. Numerous 3D/4D surveys have been carried out in connection with CO2Carbon dioxide injectionThe process of using pressure to force fluids down wells, both on land and offshore (e.g. Arts et al., 20042004 - R Arts, O Eiken, A Chadwick, P Zweigel, L Van der Meer, B ZinsznerMonitoring of CO2 injected at Sleipner using time-lapse seismic datasee more; juhlin et al., 20072007 - Christopher Juhlin, Rüdiger Giese, Kim Zinck-Jørgensen, Calin Cosma, Hesam Kazemeini, Niklas Juhojuntti, Stefan Lüth, Ben Norden, Andrea Förster3D baseline seismics at Ketzin, Germany: the CO2 SINK projectsee more; Urosevic et al., 20112011 - M. Urosevic, R. Pevzner, V. Shulakova, A. Kepic, E. Caspari, S. SharmaSeismic monitoring of CO2 injection into a depleted gas reservoir–Otway Basin Pilot Project, Australiasee more). For seismic time-lapse measurements it is important to achieve high repeatability. A useful procedure for assessing the similarity of two or more time-lapse data sets is to use repeatability metrics (cf. Kragh and Christie, 20022002 - Ed Kragh, Phil ChristieSeismic repeatability, normalized rms, and predictabilitysee more). Poor data quality can considerably reduce the detection sensitivity (presence of noise and/or non-repeatable acquisition patterns). Therefore, the same seismic recording parameters should be used for the baseline and repeat surveys. The shot points and geophones should be placed at approximately the same locations for all measurements. Also, the sourceAny process, activity or mechanism that releases a greenhouse gas, an aerosol, or a precursor thereof into the atmosphere of the seismic signal should preferably be the same. In land measurements, the position of the groundwater table affects the seismic response, and therefore all measurements should ideally be carried out at the same time of the year. Even after taking precautions to ensure that the data acquisition is carried out correctly, it is necessary to apply careful data processing in order to enable a comparison of the various datasets (Bergmann et al., 20112011 - Peter Bergmann, Can Yang, Stefan Lüth, Christopher Juhlin, Calin CosmaTime-lapse processing of 2D seismic profiles with testing of static correction methods at the CO2 injection site Ketzin (Germany)see more).
Seismic 2D surveys (i.e., seismic measurements carried out along profiles), are much cheaper than 3D measurements. Sometimes 2D land measurements can be better in resolving structure(geology) Geological feature produced by the deformation of the Earth’s crust, such as a fold or a fault(geology) A surface at which strata are no longer continuous, but are found displaced; a feature within a rock such as a fractureAny break in rock along which no significant movement has occurred; or, more generally, the spatial arrangement of rocks, e.g. thin layers, than 3D measurements acquired with similar instrumentation. By using a suitable arrangement of 2D profiles it can thus be possible to monitor CO2Carbon dioxide injectionThe process of using pressure to force fluids down wells, although it can be difficult to know exactly where to place the profiles and there is a riskConcept that denotes the product of the probability of a hazard and the subsequent consequence of the associated event to miss the CO2Carbon dioxide plumeDispersing volume of CO2Carbon dioxide-rich phase contained in target formationA body of rock of considerable extent with distinctive characteristics that allow geologists to map, describe, and name it.
The usefulness of seismic measurements varies depending on several factors, e.g. the geometry of the layer boundaries and the physical properties of the rock matrix and the pore fluid. The applicability of seismic methods needs to be assessed when selecting techniques for site characterisation and monitoringMeasurement and surveillance activities necessary for ensuring safe and reliable operation of a CGS project (storage integrity), and for estimating emission reductions, and in some settings seismic methods will not work wellManmade hole drilled into the earth to produce liquids or gases, or to allow the injection of fluids. When selecting techniques, it is also necessary to consider the environmental impact of the seismic data acquisition, e.g. the potential damage caused by using dynamite charges or Vibroseis trucks, clearing the vegetation to install geophones or building new roads to transport equipment and personnel.
Seismic borehole measurements can provide higher resolution data than surface measurements, although the lateral coverage is in general more limited. Cross-hole measurements, using a combination of borehole sensors, potentially have very high resolution in a limited volume of the subsurface. It is also common to use a combination of borehole sensors and surface signal sources, commonly referred to as vertical seismic profiling (VSP). VSP provides valuable information about the geological structure(geology) Geological feature produced by the deformation of the Earth’s crust, such as a fold or a fault(geology) A surface at which strata are no longer continuous, but are found displaced; a feature within a rock such as a fractureAny break in rock along which no significant movement has occurred; or, more generally, the spatial arrangement of rocks of the subsurface and is one of the best techniques to study seismic anisotropy. In VSP exploration, the seismic energy is produced via a surface sourceAny process, activity or mechanism that releases a greenhouse gasGas in the atmosphereThe layer of gases surrounding the earth; the gases are mainly nitrogen (78%) and oxygen (around 21%) that absorbs and emits infrared radiation emitted by the Earth’s surface, the atmosphereThe layer of gases surrounding the earth; the gases are mainly nitrogen (78%) and oxygen (around 21%), and clouds; thus, trapping heat within the surface-troposphere system. e.g. water vapour (H2O), carbon dioxide (CO2Carbon dioxide), nitrous oxide (N2O), methane (CH4), ozone (O3), sulfur hexafluoride (SF6), hydrofluorocarbons (HFCs), and perfluorocarbons (PFCs), an aerosol, or a precursor thereof into the atmosphereThe layer of gases surrounding the earth; the gases are mainly nitrogen (78%) and oxygen (around 21%) at or near a borehole. By using a receiver array in the wellManmade hole drilled into the earth to produce liquids or gases, or to allow the injectionThe process of using pressure to force fluids down wells of fluids it is possible to record both the downgoing and upgoing seismic waves. One big advantage of the method is the ability to correlate the upgoing, or reflected waves, directly to the layer boundaries. The VSP method also produces full volumetric images of the subsurface structures around the wellManmade hole drilled into the earth to produce liquids or gases, or to allow the injectionThe process of using pressure to force fluids down wells of fluids with improved seismic resolution in comparison to surface seismic methods.
The common use of VSP is to depth-correct a seismic survey, i.e. to bind surface seismic (2D or 3D) to wellManmade hole drilled into the earth to produce liquids or gases, or to allow the injectionThe process of using pressure to force fluids down wells of fluids logs and stratigraphy information. VSP can be implemented in a "walk-away" fashion to monitor the footprint of the plume as it migrates away from the injectionThe process of using pressure to force fluids down wells wellManmade hole drilled into the earth to produce liquids or gases, or to allow the injectionThe process of using pressure to force fluids down wells of fluids. In the walk-away VSP configuration the sources are arranged on radial profiles around the injectionThe process of using pressure to force fluids down wells wellManmade hole drilled into the earth to produce liquids or gases, or to allow the injectionThe process of using pressure to force fluids down wells of fluids in order to create an offset at the surface as the receivers are held in a fixed location. In connection with the CO2Carbon dioxide injectionThe process of using pressure to force fluids down wells at Ketzin, a seismic experiment has been carried out using a number of seismic sensors buried in shallow boreholes (at depths of around 50 m), below the groundwater table. Preliminary results show that it is possible to image the CO2Carbon dioxide reservoirA subsurface body of rock with sufficient porosityMeasure for the amount of pore spaceSpace between rock or sediment grains that can contain fluids in a rock and permeabilityAbility to flow or transmit fluids through a porous solid such as rock to store and transmit fluids with high resolution, by avoiding the degradation of the seismic signal when passing through the highly attenuating dry overburdenRocks and sediments above any particular stratum. (Ivandic et al., 20122012 - Monika Ivandic, Can Yang, Stefan Lüth, Calin Cosma, Christopher JuhlinTime-lapse analysis of sparse 3D seismic data from the CO2 storage pilot site at Ketzin, Germanysee more).