One method for investigating the resistivity of the subsurface is to use geoelectrical measurements, which are based on the injectionThe process of using pressure to force fluids down wells of electrical currents into the ground. Geoelectrical measurements can detect changes in fluids (i.e. fluid substitution). The depth of penetration of a surface array depends on the rock and fluid properties. In addition, data quality drops as electrodes are placed further apart.
Saline water or brine can have a very low electrical resistivity. For example, at the Ketzin injectionThe process of using pressure to force fluids down wells site the brine resistivity is approximately 0.05 Ωm (Kiessling et al., 20102010 - D. Kiessling, C. Schmidt-Hattenberger, H. Schuett, F. Schilling, K. Krueger, B. Schoebel, E. Danckwardt and J. KummerowGeoelectrical methods for monitoring geological CO2 storage: First results from cross-hole and surface-downhole measurements from the CO2SINK test site at Ketzin (Germany)see more). The injectionThe process of using pressure to force fluids down wells of CO2Carbon dioxide into a saline aquiferAn underground layer of fluid-bearing permeable rock or unconsolidated materials (gravel, sand, or silt) with significant permeability to allow flow will increase the bulk resistivity of the reservoirA subsurface body of rock with sufficient porosity and permeability to store and transmit fluids. However, dissolved CO2Carbon dioxide has very little effect on brine resistivity. Hence, this method is mainly suitable for detecting free CO2Carbon dioxide.
|  Kiessling et al., 20102010 - D. Kiessling, C. Schmidt-Hattenberger, H. Schuett, F. Schilling, K. Krueger, B. Schoebel, E. Danckwardt and J. KummerowGeoelectrical methods for monitoring geological CO2 storage: First results from cross-hole and surface-downhole measurements from the CO2SINK test site at Ketzin (Germany)see more). Cross-hole measurements provide high-resolution images in the area between the boreholes."> Kiessling et al., 20102010 - D. Kiessling, C. Schmidt-Hattenberger, H. Schuett, F. Schilling, K. Krueger, B. Schoebel, E. Danckwardt and J. KummerowGeoelectrical methods for monitoring geological CO2 storage: First results from cross-hole and surface-downhole measurements from the CO2SINK test site at Ketzin (Germany)see more). Cross-hole measurements provide high-resolution images in the area between the boreholes.">
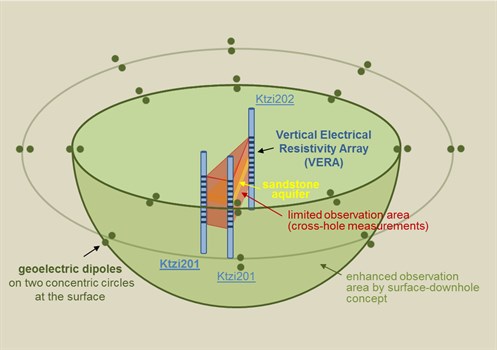
Fig. 2-3: Layout of the coCOmbined surface and downhole geoelectrical measurements at Ketzin, Germany (Kiessling et al., 20102010 - D. Kiessling, C. Schmidt-Hattenberger, H. Schuett, F. Schilling, K. Krueger, B. Schoebel, E. Danckwardt and J. KummerowGeoelectrical methods for monitoring geological CO2 storage: First results from cross-hole and surface-downhole measurements from the CO2SINK test site at Ketzin (Germany)see more). Cross-hole measurements provide high-resolution images in the area between the boreholes. The combination of downhole sensors and 16 surface dipole sensors (dipole length of 150m) is used to extend the observation area. The surface dipoles are arranged on two concentric circles with radii of 800 and 1500m. The injectionThe process of using pressure to force fluids down wells is carried out in borehole Ktzi 201. |
In Electrical Resistivity Tomography (ERT) electrical measurements are made at the surface or by electrodes in one or more boreholes. This method can be used to obtain "snapshot" images of relatively static subsurface conditions for site screening or characterisation. It can also be used to obtain a series of images showing relatively rapid changes. ERT works wellManmade hole drilled into the earth to produce liquids or gases, or to allow the injectionThe process of using pressure to force fluids down wells of fluids in both the vadose (unsaturated) and saturated subsurface zones. The extensive data resulting from measurements taken between the electrode arrays are processed to produce electrical resistivity tomographs using state-of-the-art inversion algorithms. These calculated tomographs show spatial variations in electrical resistivity and these images can be used as a guide for focusing more detailed characterisation and monitoringMeasurement and surveillance activities necessary for ensuring safe and reliable operation of a CGS project (storage integrity), and for estimating emission reductions evaluations (Newmark et al., 20012001 - R. L. Newmark, A. L. Ramirez and W. D. DailyMonitoring carbon dioxide sequestration using Electrical Resistance Tomography (ERT): sensitivity studiessee more). In connection with the CO2Carbon dioxide injectionThe process of using pressure to force fluids down wells and storage(CO2Carbon dioxide) A process for retaining captured CO2Carbon dioxide, so that it does not reach the atmosphereThe layer of gases surrounding the earth; the gases are mainly nitrogen (78%) and oxygen (around 21%) experiment at Ketzin geoelectrical measurements have been carried out using a combination of permanently installed surface and borehole sensors (Fig. 2-3), also including sensors in the injectionThe process of using pressure to force fluids down wells borehole (Kiessling et al., 20102010 - D. Kiessling, C. Schmidt-Hattenberger, H. Schuett, F. Schilling, K. Krueger, B. Schoebel, E. Danckwardt and J. KummerowGeoelectrical methods for monitoring geological CO2 storage: First results from cross-hole and surface-downhole measurements from the CO2SINK test site at Ketzin (Germany)see more).
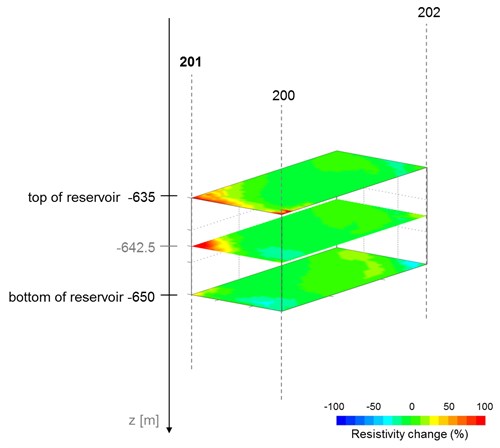
At Ketzin the cross-hole measurements provide the highest resolution data and give a smoothed image of the plume (Fig. 2-4). A combination of surface and downhole sensors was also used at Ketzin to extend the investigated subsurface volume. The geoelectrical measurements at Ketzin indicate a maximum increase in the reservoirA subsurface body of rock with sufficient porosityMeasure for the amount of pore spaceSpace between rock or sediment grains that can contain fluids in a rock and permeabilityAbility to flow or transmit fluids through a porous solid such as rock to store and transmit fluids resistivity of around 200 % after injectionThe process of using pressure to force fluids down wells.
The resistivity can also be investigated using electromagnetic (EM) methods. The magnetotelluric method images subsurface structures by mapping spatial resistivity variations using electrical currents (or telluric currents) created by natural variations in the Earth's magnetic field, e.g. by long-period electromagnetic waves from distant thunderstorms. The Earth's naturally varying electric and magnetic fields are measured over a wide range of frequencies (0.0001 to 10,000 Hz). Concurrent measurements of orthogonal components of the electric and magnetic fields permit the calculation of the impedance tensor, which is complex and frequency-dependent. Using this tensor, it is possible to gain insight into the resistivity structure(geology) Geological feature produced by the deformation of the Earth’s crust, such as a fold or a fault(geology) A surface at which strata are no longer continuous, but are found displaced; a feature within a rock such as a fractureAny break in rock along which no significant movement has occurred; or, more generally, the spatial arrangement of rocks of the surrounding material (Cantwell, 19601960 - W.H. CantwellDetection and analysis of low frequency magnetoretelluric signalssee more). The magnetotelluric sounding method was used successfully for the mapping of geothermalConcerning heat flowing from deep in the earth reservoirs starting in the early 1980s and became a standard application. In recent years, magnetotellurics has also become increasingly popular in oil and mineral exploration. Since it can probe the earth to depths of several tens of kilometres it may also be applied for monitoringMeasurement and surveillance activities necessary for ensuring safe and reliable operation of a CGS project (storage integrity), and for estimating emission reductions CO2Carbon dioxide injectionThe process of using pressure to force fluids down wells. For this, further developments are required. The resolution of magnetotelluric surveys are, however, limited by the diffusive nature of electromagnetic propagation in the earth.
|  Fig. 2-4: Resistivity difference images for the portion of the reservoirA subsurface body of rock with sufficient porosityMeasure for the amount of pore spaceSpace between rock or sediment grains that can contain fluids in a rock and permeabilityAbility to flow or transmit fluids through a porous solid such as rock to store and transmit fluids between the three boreholes at Ketzin (Kiessling et al., 20102010 - D. Kiessling, C. Schmidt-Hattenberger, H. Schuett, F. Schilling, K. Krueger, B. Schoebel, E. Danckwardt and J. KummerowGeoelectrical methods for monitoring geological CO2 storage: First results from cross-hole and surface-downhole measurements from the CO2SINK test site at Ketzin (Germany)see more). The CO2Carbon dioxide plumeDispersing volume of CO2Carbon dioxide-rich phase contained in target formationA body of rock of considerable extent with distinctive characteristics that allow geologists to map, describe, and name it spreading away from the injectionThe process of using pressure to force fluids down wells borehole (Ktzi 201) is clearly visible as a high-resistivity zone Fig. 2-4: Resistivity difference images for the portion of the reservoirA subsurface body of rock with sufficient porosityMeasure for the amount of pore spaceSpace between rock or sediment grains that can contain fluids in a rock and permeabilityAbility to flow or transmit fluids through a porous solid such as rock to store and transmit fluids between the three boreholes at Ketzin (Kiessling et al., 20102010 - D. Kiessling, C. Schmidt-Hattenberger, H. Schuett, F. Schilling, K. Krueger, B. Schoebel, E. Danckwardt and J. KummerowGeoelectrical methods for monitoring geological CO2 storage: First results from cross-hole and surface-downhole measurements from the CO2SINK test site at Ketzin (Germany)see more). The CO2Carbon dioxide plumeDispersing volume of CO2Carbon dioxide-rich phase contained in target formationA body of rock of considerable extent with distinctive characteristics that allow geologists to map, describe, and name it spreading away from the injectionThe process of using pressure to force fluids down wells borehole (Ktzi 201) is clearly visible as a high-resistivity zone
|
There are also possibilities to use a modified version of magnetotellurics in which man-made signals are used, so-called controlled sourceAny process, activity or mechanism that releases a greenhouse gasGas in the atmosphereThe layer of gases surrounding the earth; the gases are mainly nitrogen (78%) and oxygen (around 21%) that absorbs and emits infrared radiation emitted by the Earth’s surface, the atmosphereThe layer of gases surrounding the earth; the gases are mainly nitrogen (78%) and oxygen (around 21%), and clouds; thus, trapping heat within the surface-troposphere system. e.g. water vapour (H2O), carbon dioxide (CO2Carbon dioxide), nitrous oxide (N2O), methane (CH4), ozone (O3), sulfur hexafluoride (SF6), hydrofluorocarbons (HFCs), and perfluorocarbons (PFCs), an aerosol, or a precursor thereof into the atmosphereThe layer of gases surrounding the earth; the gases are mainly nitrogen (78%) and oxygen (around 21%) electromagnetics or CSEM (Bourgeois and Girard, 20102010 - Bernard Bourgeois, Jean-François GirardFirst Modelling Results of the EM Response of a CO2 Storage in the Paris Basinsee more). This method is an established tool in marine work but has so far not been used much on land. An experiment at the CO2Carbon dioxide injectionThe process of using pressure to force fluids down wells site in Ketzin has showed promising results, although there are still issues with noise (e.g. from power lines) disturbing the measurements and with the practical fieldwork procedure (Streich et al., 20112011 - Rita Streich, Michael Becken, Ulrich Matzander, Oliver RitterStrategies for land-based controlled-source electromagnetic surveying in high-noise regionssee more). The transient electromagnetic method (TEM) is another potentially useful monitoringMeasurement and surveillance activities necessary for ensuring safe and reliable operation of a CGS project (storage integrity), and for estimating emission reductions tool, provided that the electrical current loop used to generate the signal is large enough (e.g. Carcione et al., 20122012 - José M. Carcione, Davide Gei, Stefano Picotti, Alberto MicheliniCross-hole electromagnetic and seismic modeling for CO2 detection and monitoring in a saline aquifersee more; Dodds, 20052011 - K. DoddsTime-lapse EM and seismic imaging of a CO2 plume.see more). Further tests are needed to fully establish the electromagnetic methods as monitoringMeasurement and surveillance activities necessary for ensuring safe and reliable operation of a CGS project (storage integrity), and for estimating emission reductions tools for CO2Carbon dioxide injectionThe process of using pressure to force fluids down wells.